Functions with R and rvest: A Laymen’s Guide

If there had to be one topic that was so hard to comprehend after using R, it has to be functions. Everything from writing a function, to learning how to debug a function has just never had some clear instructions on how to do so. In addition, there are tools that have come out that are meant to help with this task, but can seem rather hard to understand how to utilize when solving your problem. This blog intends to get you up and running with what functions are in R, how to utilize them for tasks, and easily debug them inside RStudio to troubleshoot what is exactly going on.

Recently I had the opportunity of going to a Cider Festival, to learn and try new ciders.I’m not the biggest fan of cider’s, so naturally I opted to try almost every beer that was available, and wanted to compare what I tasted. If anyone were to ask about my taste buds, it would be that I love shandy’s, and wheat beer. None of the beer’s I tried were even remotely close to my liking, yet somehow tasted much better than I anticipated. It sure would be helpful to have a way to compare the beer’s I’ve tried to see just why I enjoyed an American Pale ale, and even a cask. Using rvest, we can easily scrape the necessary data about each beer from RateBeer to help compare them against each other to determine what similarities they may share.

But First….some business that we need to take care of

Before we get started, a few ground rules need to be established so that you get yourself on the right track for the task at hand. Interacting with the web via programming can very easily feel like uncharted terriority at first, almost like drinking your first beer: Where am I, and how did I end up here?But, fear not, as this blog will provide you the resources to not get lost navigating this abyss.

Tool Time:

In order to gain the most value from what is outlined within this blog, you will need the following tools:

  • RStudio
  • Visual Studio Code
  • GitKraken

Why do we need these you might ask? Equipping yourself with the right tools can sometimes be half the battle with r: it’s hard to figure out how to understand the problem at hand if you don’t have the necessary tools to solve the problem. In addition to these tools, I would strongly encourage you to think about using a sandbox environment, using Docker or RStudio Cloud, as R has had some pain points with encodings on different operating systems. If you would like more information on how to create your own custom sandbox environment for R, you can check out this blog for more information, or check out RStudio Cloud.

https://medium.com/@peterjgensler/creating-sandbox-environments-for-r-with-docker-def54e3491a3

https://rstudio.cloud/

At a high level, there are two generic ways of obtaining data on the web:

  • API’s — API is called Application Programming Interface
  • Web Scraping- more of a brute-force approach

Ok, so what exactly is an API, then? Should I be using it?

“An API is a messenger that takes requests, and then returns a response back to you”

API’s are setup so you can easily interact with services. Let’s say I want to pull data on Fires in Minneapolis.

Fires Confirmed 2013 - dataset by minneapolismn
For questions about this data please contactdata.world

If I wanted, I could easily pull this data via data.world’s API:

API Docs
Hosted API documentation for every OAS (Swagger) and RAML spec out there. Powered by Stoplight.io. Document, mock, test…apidocs.data.world

Web scraping, on the other hand is a much more brute-force way of obtaining data on the web. Not all sites have API’s to use, which means that it may be necessary to scrape to find. How would we go about checking if we can scrape a webpage? Simple, check the robots.txt file. Check out this video for more information on what a robots.txt file is used for:

For our case, we are using the site RateBeer, so let’s look at their file to see if there are restrictions:

https://www.ratebeer.com/robots.txt

User-agent: Mediapartners-Google
Disallow:

User-agent: *
Allow: /

Looking at RateBeer’s robots.txt file, we can see that they allow scraping, as they disallow nothing, so we are OK to proceed.

Grab a sandwich, get some coffee, and go watch this webinar from RStudio listed below. RStudio has two great webinars that cover API’s, and web-scraping in depth, we want part 2:

Extracting data from the web Part 2
Extracting data from the web Part 2 Download Materials Description The internet is a treasure trove of data, if you…www.rstudio.com

The slides for the webinar can be found here:

https://github.com/rstudio/webinars/blob/master/32-Web-Scraping/02-Web-Scraping.pdf

After I watched the webinar listed above, I was so lost on all these topics, and rightfully so. Learning about the web technologies used to engineer websites is not a small task, and can be very hard when first getting started. If you want further resources to look to, I would strongly encourage you to view these slides from useR 2016 which are very similar, and do a good job of the getting the lay of the land:

https://github.com/ropensci/user2016-tutorial/blob/master/03-scraping-data-without-an-api.pdf

Most packages developed for web scraping with R are meant for scraping either HTML or CSS parts of a webpage, not Javascript content, which is rendered in the browser. Javascript is much more complex to scrape, and can be done with RSelenium, but is not for the faint of heart:

ropensci/RSelenium
RSelenium - An R client for Selenium Remote WebDrivergithub.com

Understanding and Laying the foundation

To get our data to work with, we first need to set up some functions to acquire our variables for each beer. Now, I have only picked three beers to keep this simple, but I hope this example illustrates how powerful a function can be when put to use. Lets take a look:

In order to compare each beer, we first need to find a way to get attributes about each beer. Ratebeer provides us with basic statistics about each beer:

Pollyanna Eleanor Beer Descriptive statistics

As you can see above, we are interested in taking the descriptive statistics about each beer, but how would we go about finding what exactly links to that element? As there is no JavaScript on these webpages about each Beer, we can simply utilize tools to find the respective CSS or Xpath to the element we are interested in. The easiest way of going about this is

Now, in order to pull the data from the website, we first need to download the webpage, and then attempt to select the element we are interested in via a CSS tag or an xpath to the element we are interested in.Unquestionably, this can be an excruciating process for two reasons:

  • CSS tags should(but do not) work with rvest due to selectr having some issues(which drives finding the CSS tags): https://github.com/sjp/selectr/issues/7#issuecomment-344230855
  • Or, you have no idea if the path selected was the correct path for the element you want, which is more common than I’d like to admit

Now, at first, this seems like an almost impossible task, but fear not. We can still use an xpath to select what we are interested in extracting for further use.

Two tools are very useful for finding the correct xpath for the element that you wish to pull: Selectorgadget and the chrome developer tools.

Selector Gadget

Selectorgadget is a point-and-click CSS selector, specifically for Chrome. Simply install the chrome extension, and then click on the elements you are interested it. This will select all elements that are related to that object.Next, select anything in yellow you do not want. There you go!

Using SelectorGadget

More information on SelectorGadget can be found here:

SelectorGadget: point and click CSS selectors
SelectorGadget is an open source tool that makes CSS selector generation and discovery on complicated sites a breeze…selectorgadget.com

You can also find a well detailed walkthrough here if you need an additional example:

Selectorgadget
Selectorgadget is a javascript bookmarklet that allows you to interactively figure out what css selector you need to…cran.r-project.org

Chrome Developer Tools

If you have issues getting the correct xpath from SelectorGadget, you can also try using the Chrome developer tools, which are very user friendly.

Simply click on View-Developer Tools, which will load up the developer tools.

Next, click on the little mouse button to interact with the webpage. This will enable your cursor to show you what code is driving each element on the page.

In the below screenshot, we can see that what we select with our mouse, and the respective code which is driving that particular element.

Chrome Developer Tools selecting element on page

Click on the blue area above, as indicated above. In this case, we are interested in the stats container, as it contains the metrics that we want to compare. This will lock you on that element so your cursor does not try to select HTML or CSS for other elements. Now right click on the area in the html code highlighted(red box), and then select copy->Copy XPath. This will allow you to get down to the most specific path for where that particular element lives on the page.

Perfect! Now that we have the xpath for the element we can begin to start writing our function to extract data from the xpath.

Setting up functions

Let’s recap up to this point what we have accomplished. Up to this point, we first identified what exactly we wanted to accomplish: scrape basic statistics about each beer. We then found the necessary xpath, which identifies the element on the webpage we are interested in. Using rvest, we can write a script which allows us to

Outlined in the slides from RStudio(links at the beginning of the talk), there are three “core activities” that we need to accomplish for a given webpage in our function. Thinking about it, they make sense:

  • Pull down a webpage
  • Identify elements we want
  • Extract & pull the element out
  • Tidy up the element to make it useable

There are three functions from the rvest package which allow us to perform these steps with ease. However, as we want to perform these steps on multiple URL’s we can set up our function like so:

library(magrittr) #for pipes
library(dplyr) #for pull function
library(rvest) #get html nodes
library(xml2) #pull html data
library(selectr) #for xpath element
library(tibble)
library(purrr) #for map functions
library(datapasta) #for recreating tibble's with ease
#Sample Data
sample_data <- tibble::tibble(
  name = c("pollyanna-eleanor-with-vanilla-beans","brickstone-apa","penrose-taproom-ipa","revolution-rev-pils"),
  link = c("https://www.ratebeer.com/beer/pollyanna-eleanor-with-vanilla-beans/390639/",
           "https://www.ratebeer.com/beer/brickstone-apa/99472/",
           "https://www.ratebeer.com/beer/penrose-taproom-ipa/361258/",
           "https://www.ratebeer.com/beer/revolution-rev-pils/360716/"
  )
)
#the function:
get_beer_stats1 <- function(x){
    read_html(x) %>%
    html_nodes(xpath = '//*[@id="container"]/div[2]/div[2]/div[2]') %>%
    html_text()
}

We could also write our function to be more explicit on when values change, making it easier to step through and debug in RStudio:

get_beer_stats2 <- function(x){
  url <- read_html(x)
  html_doc <- html_nodes(url, xpath = '//*[@id="container"]/div[2]/div[2]/div[2]')
  stats <- html_text(html_doc)
  return(stats)
}

Hold up, I thought we were supposed to make sure every action is precisely logged so them computer understands it? Don’t we need some sort of for-loop, that acts as a counter to increase after each URL? Why didn’t we use the dplyr::pull command to literally pull the vector out of the dataframe to iterate on first?

One of the issues of working with purrr is understand how to think about the problem you are facing in the right mindset. Thinking about the problem, we can approach it from the following angles:

  • I have a dataframe of URL’s, and I want to iterate over each row(or URL), and perform a given set of actions for each URL
  • I have a dataframe with a column of URL’s and for each URL, I want to operate on each URL
  • Treating my column of URL’s in my dataframe as a vector, I want to operate on each element in the vector

You see, purr’s main workhorse function map, is designed to iterate over objects which contain a bunch of elements, which then allow you as the user to focus on writing a function that does some action. In R, most times these objects are either lists, list-columns, or simply a vector. In doing this, it allows you to have a workflow as such:

  • Determine what you would like to do for a given element
  • Turn that “recipie” into a function
  • Apply the recipe with purr over the object (and if necessary, create a new column to store the results in)

Ok, now let’s apply the function we just created to our data, and see if it works:

sample_data_rev <- sample_data %>%
  mutate(., beer_stats = map_chr(.x = link, .f = get_beer_stats1))

Before we move on, lets break down what is exactly happening. First, we pipe in the dataframe, and say we want to add a new column with mutate. Next, we create a new column defined as a character column using map_chr (or vector), and then apply our custom function.

Getting the data & Debugging in RStudio

Now that our core function is defined, we can use RStudio to walk through our function if we wanted to see how values are changing. Simply enable debug mode by going to:

Debug->On Error-> Error Inspector

Next, simply wrap your function with debug like:

debug(
get_beer_stats1 <- function(x){
    read_html(x) %>%
    html_nodes(xpath = '//*[@id="container"]/div[2]/div[2]/div[2]') %>%
    html_text()
}
)

When you run your code that calls your function, you will enter into debug mode so you can view how values change in the code:

sample_data_rev <- sample_data %>%
  mutate(., beer_stats = map_chr(.x = link, .f = get_beer_stats1))

Expanding on our example, lets say that we have URL’s that may cause some hiccups. How would we make an function which could hand these errors with ease?

purr equips us with error handling functions to wrap our function in to gracefully handle errors. We can add error handling using the possibly function:

sample_data_rev <- sample_data %>%
  mutate(., beer_stats = map_chr(.x = link,    possibly(get_beer_stats1, otherwise= "NULL")))

Possibly is very similar to a try-catch, which allows us to wrap our created function with a different function for error handling. This can be a bit confusing at first glance, but makes sense once you have it setup properly.

Encoding and R: Entering the Abyss

Before we move further, it may be worth noting that the following is what I will call “the Abyss”, or Mordor. Beware that this is not for the faint of heart, so if you feel that you are ready, then proceed. Otherwise, go make a sandwich, and take a nap.

Mordor, aka how Encoding feels in R

For me, encoding in R has really reminded me of Mordor from Lord of the Rings. It just seems like some never ending pit that is almost near-death. Not to worry though, you are in good hands. Let’s go.

So we have our data, and it should be all set for cleanup, right? Nope. Why is this the case? Earlier we mentioned that our workflow consisted of the following steps:

  • Pull down a webpage
  • Identify elements we want
  • Extract & pull the element out
  • Tidy up the element to make it useable

Part of the issue with this workflow is that it assumes once we pull out the data from the webpage, it should be ‘ready to go, right off the boat’, which unfortunately, is not the case with data from the web. You see, data from the web has to be encoded, and finding or even detecting encoding issues can be a real hassle, as you may not find out until much further downstream in your analysis process, like I did.

Before we step in any further, I would encourage you to first read the following articles. This will help lay the foundation for understanding what exactly is wrong with our text data, and strategies to help detect the culprit:

Character encodings for beginners
What is a character encoding, and why should I care?www.w3.org

R for Data Science
This book will teach you how to do data science with R: You'll learn how to get your data into R, get it into the most…r4ds.had.co.nz

To re-iterate, our computer (or machine, really), stores data in terms of bytes. These bytes are then encoded into different locales, such as UTF-8, or ANSI. Depending on how you have your platform(or machine’s) native encoding set up, R can cause you much grief with this. As a rule of thumb, it is always best to try to interface with UTF-8 whenever possible, as it causes the least pain points, regardless of what your platform’s native encoding may be. Finding out where the source of encoding issues arise can be a challenge, so the following tools will help:

  • textclean package — used to detect issues with encoded text
  • rvest — good for attempting to guess the encoding if you are unsure
  • datapasta — good for easily recreating a tibble
  • stringi- brute force way to view if the unicode matches what we are looking at, and clean it
  • base::charToRaw — to view raw bytes of the string
  • tools::showNonASCII and iconv to show non-ASCII chars
  • Unicode inspector - https://apps.timwhitlock.info/unicode/inspect
  • Unicode Table - http://www.utf8-chartable.de/

Our general workflow will be as such:

  • Detect or identify issues with the text
  • attempt to fix encoding

Before we move on, I would strongly encourage you to make sure you can view whitespace in RStudio via Tools-Global Options-Code, and show whitespace characters.

Configuring whitespace characters in RStudio

Also, go into Visual Studio Code, and do the same by going to View- Toggle Render Whitespace as well.

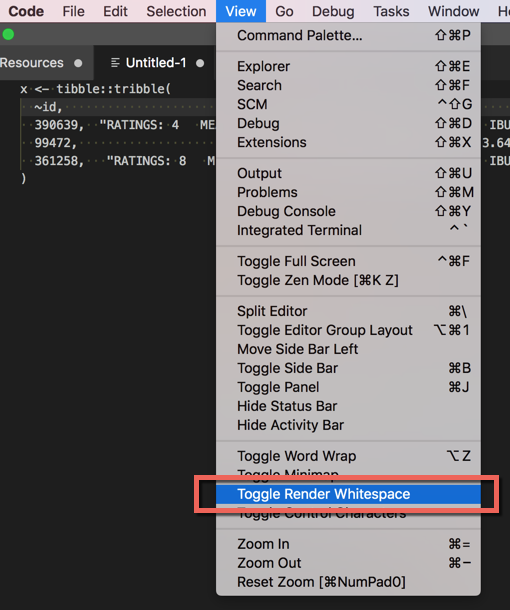
Toggle Render Whitespace in Visual Studio Code

Lets take a small bit of code to use for an example. Suppose you get this data:

bad_data <- tibble::tribble(
 ~id, ~value,
 390639, “RATINGS: 4 MEAN: 3.83/5.0 WEIGHTED AVG: 3.39/5 IBU: 35 EST. CALORIES: 204 ABV: 6.8%”,
 99472, “RATINGS: 89 WEIGHTED AVG: 3.64/5 EST. CALORIES: 188 ABV: 6.25%”,
 361258, “RATINGS: 8 MEAN: 3.7/5.0 WEIGHTED AVG: 3.45/5 IBU: 85 EST. CALORIES: 213 ABV: 7.1%”
)
> Encoding(bad_data$value)
[1] "UTF-8" "UTF-8" "UTF-8"

How would we detect if there is an issue with it? We can see from above that the data is encoded as UTF-8, so we should be fine then……right? Wasn’t that what the webpage told us it was encoded in? Yes, but looking deeper into the data, there appears to be some characters that diden’t get converted over correctly. So how exactly do we ‘correct’ a bad UTF-8 file?

The First Ring of Fire: Detecting the problem

Well, for starters, we could try re-create the dataframe using datapasta as below, and hope that we can see something

datapasta::tribble_paste(bad_data)

Lucky for us, when we do this, we can see that there is something that seems funny:

Odd red spaces in our data?

Ok, so there’s some odd red spaces inside our data…what does that even mean RStudio?If we paste the output into a Visual Studio Code, we can see something a bit pecuiliar:

After looking at the above screenshot, something seems to be a bit off. Why is there no space where the blue arrows are? Seems a bit odd. Say we wanted to look at not just 3 beers, but hundreds, maybe thousands of beers, could this work? Sure, but there has to be a better method, and there is:

#Truncated Output
textclean::check_text(bad_data$value)

=========
NON ASCII
=========

The following observations were non ascii:

1, 2, 3

The following text is non ascii:

1: RATINGS: 4   MEAN: 3.83/5.0   WEIGHTED AVG: 3.39/5   IBU: 35   EST. CALORIES: 204   ABV: 6.8%
2: RATINGS: 89   WEIGHTED AVG: 3.64/5   EST. CALORIES: 188   ABV: 6.25%
3: RATINGS: 8   MEAN: 3.7/5.0   WEIGHTED AVG: 3.45/5   IBU: 85   EST. CALORIES: 213   ABV: 7.1%

*Suggestion: Consider running `replace_non_ascii`

The textclean package is a derivative of the qdap package, which is designed to work with text data, but requires rJava to work properly. textclean is a port from the qdap ecosystem, and much lighter, thus allowing us to use it to detect issues with our text. As we can see above, there are plenty of errors, but this allows us to verify that non-ascii characters exist within our text, and hence causes us headaches if we don’t take care of them now.

Now, if you are like me, attempting to get a grip on what exactly is going on in the string can be a bit of a challenge: how do we know where in the string these issues occur? Fortunately for us, base-r provides some excellent tools to help detect this:

> iconv(bad_data$value[[2]], to = "ASCII", sub = "byte")
[1] "RATINGS: 89<c2><a0><c2><a0> WEIGHTED AVG: 3.64/5<c2><a0><c2><a0> EST. CALORIES: 188<c2><a0><c2><a0> ABV: 6.25%"
> tools::showNonASCII(x$value[[2]])
1: RATINGS: 89<c2><a0><c2><a0> WEIGHTED AVG: 3.64/5<c2><a0><c2><a0> EST. CALORIES: 188<c2><a0><c2><a0> ABV: 6.25%

The tools package and iconv in R both allow us to see that sure enough, there appears to be some odd characters indicated by the <>.

If you want to get a better feel for what exactly these characters are, we can plug the raw output from datapasta’s tribble_paste into Tim Whitlock’s Unicode Inspector, and we can see that sure enough, we have a character called “No Break Space”

No Break Space

and the respective UTF-16 code. To verify, we can plug in that code with the prefix \u, and the code from above, and sure enough:

str_detect(bad_data$value[[2]], “\u00A0”)

The Second Ring of Fire: Fixing UTF-8

It works! Now we need to figure out how to repair the string.To repair the string, we could go about fixing it via rvest, textclean, or stringi:

bad_data <- tibble::tribble(
 ~id, ~value,
 390639, “RATINGS: 4 MEAN: 3.83/5.0 WEIGHTED AVG: 3.39/5 IBU: 35 EST. CALORIES: 204 ABV: 6.8%”,
 99472, “RATINGS: 89 WEIGHTED AVG: 3.64/5 EST. CALORIES: 188 ABV: 6.25%”,
 361258, “RATINGS: 8 MEAN: 3.7/5.0 WEIGHTED AVG: 3.45/5 IBU: 85 EST. CALORIES: 213 ABV: 7.1%”
)
#' for reference
#' https://stackoverflow.com/questions/29265172/print-unicode-character-string-in-r
#' stringi also uses mostly UTF-8, which is very comforting to know
#'https://jangorecki.gitlab.io/data.table/library/stringi/html/stringi-encoding.html
str_detect(x$value, "\u00A0")
ex1 <- textclean::replace_non_ascii(bad_data$value)
ex2 <- rvest::repair_encoding(bad_data$value)

textclean will eliminate the values it detects, while rvest will try to preserve the value. While rvest can (and does offer this capability), it doesn’t do the best job of cleaning the text data reliably. Instead, stringi offers us the function str_trans_general, which will allow us to keep our three spaces between each characters intact. This will allow us to use those spaces later on as delimiters to clean the data even further.

bad_data$value <- stringi::stri_trans_general(bad_data$value, “latin-ascii”)

Scaling up: Encoding with large-er amounts of data

Now, this sounds awesome, but maybe you are like me, and find a massive amount of beer data (say 2GB), and find that there may be some encoding issues…..we could try and run a function to clean the data after import, but that could take quite a bit of time. Is there a better way of dealing with this mess? Yes, there is. Enter iconv:

ICONV
The iconv program converts text from one encoding to another encoding. More precisely, it converts from the encoding…www.gnu.org

iconv is a GNU command-line utility that helps with force converting data into it’s correct form, while still trying to retain as much data as possible.

Let’s use data from here as an example:

RateBeer reviews - dataset by petergensler
Data from https://snap.stanford.edu/data/web-RateBeer.htmldata.world

Now, at first glance the data may seem a bit messy, but let’s focus on trying to convert the data into UTF-8. First, lets use gunzip from r to unzip the file to a directory.

#Gunzip Ratebeer 
gunzip(filename = “~/petergensler/Desktop/Ratebeer.txt.gz”,
 destname = “~/petergensler/Desktop/Ratebeer.txt”, remove= FALSE)

The ~ in this command simply means relative to your Home directory on your machine. Simply type cd inside a terminal, and you will be take to your home directory.

Next, we can use bash to determine how many lines are in this file via wc -l, and we can also see what bash thinks the encoding is with file -I:

wc -l Ratebeer.txt
22212596 Ratebeer.txt
file -I Ratebeer.txt
Ratebeer.txt: text/plain; charset=utf-8

Ok, so this looks to appear ok, but with 22 million lines, this has to be a hassle to fix. Not quite iconv makes this process a breeze:

Approach 1:
iconv −f iso−8859−1 −t UTF−8 Ratebeer.txt > RateBeer-iconv.txt
Approach 2:
iconv -c -t UTF-8 Ratebeer.txt > Ratebeer-iconv.txt

With approach one, we try to take the file in what we think the file should be, and specify that we want it to be UTF-8, and try to overwrite it. Approach two is a much more brute-force approach, as we simply tell iconv that we want to convert to UTF-8, and create a new file. Woila! We can now read the file in as raw lines if needed, and no hiccups, all thanks to iconv.

One thing to note is that while R does have an iconv function, I have found the command line utility to be much more versatile for my needs, and you can simply put a bash chunk in RMarkdown notebook. Use the command line.

Part 5: Cleaning up the data

Now that we have obtained our data, and cleaned the encoding, let’s see if we can try to get the basic statistics into their respective columns. At first glance, this seems simple, as we just need to split the statistics column on a delimiter, and life should be good. But of course one of the beers I have does not have the same amount of elements as the other’s thus wreaking havoc at first sight (as if encoding was already challenging enough).

Just to recap, our data looks like this:

bad_data <- tibble::tribble(
                                    ~name,                                                                         ~link,                                                                                      ~beer_stats,
   "pollyanna-eleanor-with-vanilla-beans",  "https://www.ratebeer.com/beer/pollyanna-eleanor-with-vanilla-beans/390639/",  "RATINGS: 4   MEAN: 3.83/5.0   WEIGHTED AVG: 3.39/5   IBU: 35   EST. CALORIES: 204   ABV: 6.8%",
                         "brickstone-apa",                         "https://www.ratebeer.com/beer/brickstone-apa/99472/",                           "RATINGS: 89   WEIGHTED AVG: 3.64/5   EST. CALORIES: 188   ABV: 6.25%",
                    "penrose-taproom-ipa",                   "https://www.ratebeer.com/beer/penrose-taproom-ipa/361258/",   "RATINGS: 8   MEAN: 3.7/5.0   WEIGHTED AVG: 3.45/5   IBU: 85   EST. CALORIES: 213   ABV: 7.1%",
                    "revolution-rev-pils",                   "https://www.ratebeer.com/beer/revolution-rev-pils/360716/",   "RATINGS: 34   MEAN: 3.47/5.0   WEIGHTED AVG: 3.42/5   IBU: 50   EST. CALORIES: 150

Part of the key to understanding the task at hand is twofold- we want to split the data into each column but using the : to keep the key-value pair relationship.

final_output <- bad_data %>%
  # create a new list column, str_split returns a list
  mutate(split = str_split(string, "  ")) %>%
  # then unnest the column before further data prep
  unnest() %>%
  # you can now separate in a fixed 2 length vector 
  separate(split, c("type", "valeur"), ": ") %>%
  # then get the result in column with NA in cells where you did not    have value in string
  spread(type, valeur) %>%
  rename_all(str_trim) %>%
  select(-string, -link)
#> # A tibble: 3 x 6
#>     ABV `EST. CALORIES`   IBU     MEAN `WEIGHTED AVG` RATINGS
#> * <chr>           <chr> <chr>    <chr>          <chr>   <chr>
#> 1  6.8%             204    35 3.83/5.0         3.39/5       4
#> 2  7.1%             213    85  3.7/5.0         3.45/5       8
#> 3 6.25%             188  <NA>     <NA>         3.64/5      89

Understand that when I first ran this script, the very first line failed right out the gate — — due to encoding issues, but I never got an error message until actually trying to use the spread function.

At first, this can seem a bit convoluted, especially if you are unfamiliar with the list-column.When I first looked at this code, it seemed like the str_split just had a really odd behavior, and was almost an unnecessary burden on the code. Unnesting the list-column almost creates a cartesian-like join which takes each record, and then makes it so that each row has every possible combination of every value, thus making it possible to spread, and spread dynamically.

Now our table looks like this:

> head(final_output)
# A tibble: 4 x 7
                                  name   ABV `EST. CALORIES`   IBU     MEAN RATINGS `WEIGHTED AVG`
                                 <chr> <chr>           <chr> <chr>    <chr>   <chr>          <chr>
1                       brickstone-apa 6.25%             188  <NA>     <NA>      89         3.64/5
2                  penrose-taproom-ipa  7.1%             213    85  3.7/5.0       8         3.45/5
3 pollyanna-eleanor-with-vanilla-beans  6.8%             204    35 3.83/5.0       4         3.39/5
4                  revolution-rev-pils    5%             150    50 3.47/5.0      34         3.42/5

From this, it’s interesting to note that the beer with the most amount of ratings does not have an average review, but the Pollyanna seems to have the highest score.

Closing Thoughts

As you finish up reading this article, I would encourage you to try and take some beers (or beverages of your choice), and try to collect data on them. What do you notice? Is there a correlation between ABV(how strong the drink can be) and the beer’s average review score? I hope this tutorial has been able to help you gain insights into how to use R to your advantage when trying to solve problems, and that you have learned more about encoding in R, and tools to help when faced with these challenges. I’ve outlined some of my thoughts below as I’ve been reflecting on how this data has challenged me in so many ways, and not just with R, but in my personal workflow in general.

Encoding

As I have been working with R over the past few days, one of the things that I’ve continued to notice is that when R fails, it can be hard to explicitly tell when it failed and why.As a novice coming into R, I think this makes it incredibly challenging to diagnose what tool could be failing, as R does not fail fast, and fail hard. With the encoding of our strings:

  • Did reading the html fail?
  • Was it just tidyr that had issues with UTF-8, or this a deeper issue?
  • If base r has so many encoding issues, is this a “firm foundation” for any project, work related or not?

Going through the hell of encoding issues definitely makes it clear that if you are using Windows, encoding can be a disaster with R. For me personally, I actually looked at a different flavor of R released from TIBCO called TERR:

TIBCO® Enterprise Runtime for R
In the TIBCO Enterprise Runtime for R documentation, you can find technical guidance on creating and distributing…docs.tibco.com

because so much of base-r’s encoding issue were just such a hassle to mess with. These issues while small, I think almost sent a message regarding R’s core: it is simply not a stable foundation. Working with functions and not trusting the output can be extremely hindering from a development point of view. The tidyverse definitely has a lot to offer for newcomers with new packages being developed, but I think this raises up a good question: should you be using R in production pipelines, or even for analysis purposes? Everything seems to be so smooth when you don’t hit any of these issues, but once you do, it’s a true pain to debug, especially for a novice to the language.

purr map vs dplyr: Riding the line

purrr at first sight seems like an ideal package, but can be hard to work with if you don’t have the right use case. In our example, we had URL’s that we want to apply a function over.

However, while purrr is designed to apply functions to objects, most times we are simply interested in applying a function such as converting POSIX to datetime via a predicate function:

library(lubridate)
library(dplyr)
x <- data.frame(date=as.POSIXct("2010-12-07 08:00:00", "2010-12-08 08:00:00"),
                orderid =c(1,2))
str(x)
x <- mutate_if(x, is.POSIXt, as.Date)
str(x)

Purrr really shines when you need to iterate over elements with custom functions, but can be hard to come to grips if all you have done is using a mutate_if in your workflow. On the contrary, it can also be just as hard trying to figure out what these newer functions in dplyr can do for you, if you have never seen them in action.

R has good merits with being a functional programming language: it allows you to operate on data with ease, and there is plenty of functions at your disposal to do so. If anything, one of the biggest challenges I faced as I wrote this article is just where exactly to start when looking for a solution: R Manual, stack overflow, a particular package, or even the RStudio Community. In the right hands, and with the right skillset, R can be a powerful tool when put to good use, but is not for the faint of heart. What do you think? Do you think R is powerful enough for your everyday tasks, or do you think base-r feels unstable at times?

Source: https://medium.com/@peterjgensler/function...

Big Challenge in Deep Learning: Training Data

Hello World. Today we are going to cover one of the most central problem in Deep Learning — training data problem.

We at DeepSystems apply deep learning to various real-world tasks. Here are some of them: self-driving cars, receipt recognition, road defects detection, interactive movie recommendations and so on.

And most of our time we spend not on building neural networks, but on dealing with training data. Deep Learning needs lots of data and sometimes it takes an hour to annotate just one image! We always thought: is there a way to speed up our work? Well, we found it.

We are proud to announce new awesome feature of Supervisely: AI powered annotation tool to segment objects on images much faster.

Here we will focus on computer vision, but similar thoughts can be applied to a large diversity of data: text, audio, sensor data, medical data and so on.

Big picture: more data — smarter AI

Let me start with our small modification of very famous slide from Andrew Ng.

It is not a secret that deep learning outperforms other machine learning algorithms. Let’s get some insights from this graph (some of them may seem obvious but …).

Conclusion 0: AI products need data.

Conclusion 1: the more data we have — the smarter AI will be.

Conclusion 2: industry giants have much more data than others.

Conclusion 3: quality gap in AI products is defined by amount of data.

So, network architecture can strongly influence the performance of an AI system, yet the amount of training data has biggest impact on performance. Companies which focused on data gathering provide better AI products and are hugely successful.

Common mistake: AI is all about building neural nets.

Let me show you a chart.

When people think about AI they think about the algorithms, but they should also think about the data. Algorithms are free: Google and other giants tend to share their state-of-the-art research with the world, but what they don’t — they don’t share data.

Lots of people have jumped on AI hype train and created awesome tools to build and train neural networks, but very few focus on training data. When companies try to apply AI they have all the tools to train neural networks but no tools to develop training data.

Andrew Ng Says Enough Papers, Let’s Build AI Now!

Nice idea, we agree with him. There are a lot of papers and open-source implementations of state of the art neural network architectures that can cover almost all real-word problems. Imagine, you got new 1 billion dollars idea. The first question will not be: what kind of neural network will i use? Most probably it will be: Where can i get the data to build MVP?

Source

Sources of Training data. Let’s find a silver bullet.

Let’s consider some available options.

  • Open-sourced datasets. The value of deep NN is in the data it is used to train it. Most available data in computer vision research are tailored to the problem of a specific research group and it is often that new researchers need to collect additional data to solve their own problems. That’s why it is not a solution in most cases.
  • Artificial data. For some tasks like OCR or text detection it is ok. But many examples (face detection, medical images, …) nicely illustrate that it is very hard to generate or even impossible. The common practice is to use artificial data in combination with real annotated images when it is possible.
  • Web. It is hard to automatically collect high quality training data. Most likely that human should correct and filter it.
  • Order image annotation from someone. There are some companies that provide such services. And, yes, we are no exception. But strong drawback is that you can not iterate fast. Usually even data scientist is not sure about how to annotate. General pipeline is to make iterative research: annotate small portion of images -> build NN -> check the results. Each new experiment will influence the next one.
  • Annotate images by hands. Only you understand your task. Domain expertise is crucial. Medical image annotation is a good example: only doctor knows where tumor is. We understand that this process is time consuming, but if you want custom AI — there is no other ways.

So, as we can see, there is no silver bullet. And most common scenario is to create own task specific training data, generate artificial data and merge them with public datasets if it is possible.

The key is that for your custom task you have to create own unique dataset, fo sho.

Let’s utilize Deep learning to build Deep Learning.

What? The idea is the following. Deep learning approaches are data hungry and their performance is strongly correlated with the amount of available training data.

Let me show you how annotation process is hard. Here is the raw numbers of how much time annotation process can take. Let’s consider Cityscapes dataset(useful for self-driving cars). Fine pixel-level annotation of a single image from cityscapes required more than 1.5 hours on average. They annotated 5000 images. With a simple math we can calculate, that they spent about 5000 * 1.5 = 7500 hours. Consider, 1 hour = $10 (close to minimum wage in USA). Thus, only annotation for such dataset costs around $75K (not including additional costs).

It is also surprising that only single self-driving company has 1000 in-house workers that do image annotation. And that’s the tip of the iceberg.

Imagine how much time and money companies and individuals spend for image annotation. It is unbelievable. This is the huge obstacle to progress in AI. We have to do annotation for our own task, but it can last forever 😰.

Can neural networks help us to make it faster? Think about that. We are not the first who tried to answer the question.

Field of semi-automated annotation of object instances has a long history. There are many classical methods to speed up annotation like SuperpixelsWatershedGrabCut. In last few years researchers try to utilize deep learning for this task (link1link2link3). Classical methods work bad and have many hyperparameters to search for every image, it is hard to generalize them and correct their results. Latest Deep Learning based approaches are works much more better, but in most cases they are not opensourced, it is hard to implement, reproduce results and integrate to any available annotation platform.

But we are the first who make AI powered annotation tools available for everyone. We designed our own NN architecture that has concepts similar to three links above. It also has one big advantage: our NN is class-agnostic. This mean that it can segment pedestrians, cars, potholes on the road surface, tumors on medical images, indoor scenes, food ingredients, objects from satellite and other cool stuff.

So, How does it work?

How to use AI powered segmentation tool

You just have to crop the interested object and neural network will segment it. It is very important that you can interact with it. You can click inside and outside object to correct mistakes.

Unlike semantic segmentation that partitions an image into multiple regions of pre-defined semantic categories, our interactive image segmentation aims at extracting the object of interest based on user inputs.

The primary goal of interactive segmentation is to improve overall user experience by extracting the object accurately with minimal user effort. Thus we significantly speed up the annotation process. There are some examples below. See for yourself.

Self-driving cars

As you can see from our 45 seconds test AI powered annotation tool allows to annotate each image in a few clicks. While it is needed 57 clicks with polygonal tool to annotate single car.

Segmentation of food ingredients

This example demonstrates that with polygonal tool it is really hard and slow precisely segment objects of irregular shapes and with not straight edges. We would like to emphasise that clicks inside and outside object are much “cheaper” with respect to clicks on the edges.

This was our first attempt. Of course, there are cases when smart annotation works bad. But we are going to constantly improve the quality and make simple way for domain adaptation: to customize tool for specific task inside Supervisely without coding.

Conclusion

Data is a key in deep learning. It was time consuming and very expensive. But we and deep learning community actively try to solve training data problem. First steps are already done, results are promising, let’s keep going.

We deliberately missed the topic about unsupervised learning. It is a very promising field of study, but today supervised learning dominates in real world applications.

In the next posts we will try to cover all possible use cases to help you understand that it is suitable for your tasks.

Source: https://hackernoon.com/%EF%B8%8F-big-chall...

Build your first basic Android game in just 7 minutes (with Unity)

Making a fully working game for Android is much easier than you might think. The key to successful Android development— or any kind of development— is to know what you want to achieve and find the necessary tools and skills to do it. Take the path of least resistance and have a clear goal in mind.

When it comes to creating games, the best tool in my opinion is Unity. Yes, you can make a game in Android Studio, but unless you’re experienced with Java and the Android SDK it will be an uphill struggle. You’ll need to understand what classes do. You’ll need to use custom views. You’ll be relying on some additional libraries. The list goes on.

Unity is a highly professional tool that powers the vast majority of the biggest selling titles on the Play Store.

Unity on the other hand does most of the work for you. This is a game engine, meaning that all the physics and many of the other features you might want to use are already taken care of. It’s cross platform and it’s designed to be very beginner-friendly for hobbyists and indie developers.

At the same time, Unity is a highly professional tool that powers the vast majority of the biggest selling titles on the Play Store. There are no limitations here and no good reason to make life harder for yourself. It’s free, too!

To demonstrate just how easy game development with Unity is, I’m going to show you how to make your first Android game in just 7 minutes.

No – I’m not going to explain how to do it in 7 minutes. I’m going to do it in 7 minutes. If you follow along too, you’ll be able to do the precise same thing!

Disclaimer: before we get started, I just want to point out that I’m slightly cheating. While the process of making the game will take 7 minutes, that presumes you’ve already installed Unity and gotten everything set up. But I won’t leave you hanging: you can find a full tutorial on how to do that over at Android Authority.


Adding sprites and physics

Start by double clicking on Unity to launch it. Even the longest journey starts with a single step.

Now create a new project and make sure you choose ‘2D’. Once you’re in, you’ll be greeted with a few different windows. These do stuff. We don’t have time to explain, so just follow my directions and you’ll pick it up as we go.

The first thing you’ll want to do is to create a sprite to be your character. The easiest way to do that is to draw a square. We’re going to give it a couple of eyes. If you want to be even faster still, you can just grab a sprite you like from somewhere.

Save this sprite and then just drag and drop it into your ‘scene’ by placing it in the biggest window. You’ll notice that it also pops up on the left in the ‘hierarchy’.

Now we want to create some platforms. Again, we’re going to make do with a simple square and we’ll be able to resize this freehand to make walls, platforms and what have you.

There we go, beautiful. Drop it in the same way you just did.

We already have something that looks like a ‘game’. Click play and you should see a static scene for now.

We can change that by clicking on our player sprite and looking over to the right to the window called the ‘inspector’. This is where we change properties for our GameObjects.

Choose ‘Add Component’ and then choose ‘Physics 2D > RigidBody2D’. You’ve just added physics to your player! This would be incredibly difficult for us to do on our own and really highlights the usefulness of Unity.

We also want to fix our orientation to prevent the character spinning and freewheeling around. Find ‘constraints’ in the inspector with the player selected and tick the box to freeze rotation Z. Now click play again and you should find your player now drops from the sky to his infinite doom.

Take a moment to reflect on just how easy this was: simply by applying this script called ‘RigidBody2D’ we have fully functional physics. Were we to apply the same script to a round shape, it would also roll and even bounce. Imagine coding that yourself and how involved that would be!

To stop our character falling through the floor, you’ll need to add a collider. This is basically the solid outline of a shape. To apply that, choose your player, click ‘Add Component’ and this time select ‘Physics 2D > BoxCollider2D’.

Take a moment to reflect on just how easy this was: simply by applying this script called ‘RigidBody2D’ we have fully functional physics.

Do the precise same thing with the platform, click play and then your character should drop onto the solid ground. Easy!

One more thing: to make sure that the camera follows our player whether they’re falling or moving, we want to drag the camera object that’s in the scene (this was created when you started the new project) on top of the player. Now in the hierarchy (the list of GameObjects on the left) you’re going to drag the camera so that it is indented underneath the player. The camera is now a ‘child’ of the Player GameObject, meaning that when the player moves, so too will the camera.


Your first script

We’re going to make a basic infinite runner and that means our character should move right across the screen until they hit an obstacle. For that, we need a script. So right click in the Assets folder down the bottom and create a new folder called ‘Scripts’. Now right click again and choose ‘Create > C# Script’. Call it ‘PlayerControls’.

For the most part the scripts we create will define specific behaviors for our GameObjects.

Now double click on your new script and it will open up in Visual Studio if you set everything up correctly.

There’s already some code here, which is ‘boiler plate code’. That means that it’s code that you will need to use in nearly every script, so its ready-populated for you to save time. Now we’ll add a new object with this line above void Start():

Then place this next line of code within the Start() method to find the rigidbody. This basically tells Unity to locate the physics attached to the GameObject that this script will be associated with (our player of course). Start() is a method that is executed as soon as a new object or script is created. Locate the physics object:

XMLSELECT ALL

XMLSELECT ALL

rb = GetComponent<Rigidbody2D>();

Add this inside Update():

JAVASELECT ALL

JAVASELECT ALL

rb.velocity = new Vector2(3, rb.velocity.y);

Update() refreshes repeatedly and so any code in here will run over and over again until the object is destroyed. This all says that we want our rigidbody to have a new vector with the same speed on the y axis (rb.velocity.y) but with the speed of ‘3’ on the horizontal axis. As you progress, you’ll probably use ‘FixedUpdate()’ in future.

Save that and go back to Unity. Click your player character and then in the inspector select Add Component > Scripts and then your new script. Click play, and boom! Your character should now move towards the edge of the ledge like a lemming.

Note: If any of this sounds confusing, just watch the video to see it all being done – it’ll help!


Very basic player input

If we want to add a jump feature, we can do this very simply with just one additional bit of code:

JAVASELECT ALL

JAVASELECT ALL

if (Input.GetMouseButtonDown(0))  {
         rb.velocity = new Vector2(rb.velocity.x, 5);
         }

This goes inside the Update method and it says that ‘if the player clicks’ then add velocity on the y axis (with the value 5). When we use if, anything that follows inside the brackets is used as a kind of true or false test. If the logic inside said brackets is true, then the code in the following curly brackets will run. In this case, if the player clicks the mouse, the velocity is added.

Android reads the left mouse click as tapping anywhere on the screen! So now your game has basic tap controls.


Finding your footing

This is basically enough to make a Flappy Birds clone. Throw in some obstacles and learn how to destroy the player when it touches them. Add a score on top of that.

If you get this down, no challenge will be too great in future

But we have a little more time so we can get more ambitious and make an infinite runner type game instead. The only thing wrong with what we have at the moment is that tapping jump will jump even when the player isn’t touching the floor, so it can essentially fly.

Remedying this gets a little more complex but this is about as hard as Unity gets. If you get this down, no challenge will be too great in future.

Add the following code to your script above the Update() method:

CPPSELECT ALL

CPPSELECT ALL

public Transform groundCheck;
public Transform startPosition;
public float groundCheckRadius;
public LayerMask whatIsGround;
private bool onGround;

Add this line to the Update method above the if statement:

SELECT ALL

SELECT ALL

onGround = Physics2D.OverlapCircle(groundCheck.position, groundCheckRadius, whatIsGround);

Finally, change the following line so that it includes && onGround:

JAVASELECT ALL

JAVASELECT ALL

if (Input.GetMouseButtonDown(0) && onGround) {

The entire thing should look like this:

CSSELECT ALL

CSSELECT ALL

public class PlayerControls : MonoBehaviour
 {
     public Rigidbody2D rb;
     public Transform groundCheck;
     public Transform startPosition;
     public float groundCheckRadius;
     public LayerMask whatIsGround;
     private bool onGround;

void Start() {
     rb = GetComponent<Rigidbody2D>();
     }

    void Update() {
         rb.velocity = new Vector2(3, rb.velocity.y);
         onGround = Physics2D.OverlapCircle(groundCheck.position, groundCheckRadius, whatIsGround);        
         if (Input.GetMouseButtonDown(0) && onGround) {
                 rb.velocity = new Vector2(rb.velocity.x, 5);
                 }

    }

}

What we’re doing here is creating a new transform – a position in space – then we’re setting its radius and asking if it is overlapping a layer called ground. We’re then changing the value of the Boolean (which can be true or false) depending on whether or not that’s the case.

So, onGround is true if the transform called groundCheck is overlapping the layer ground.

If you click save and then head back to Unity, you should now see that you have more options available in your inspector when you select the player. These public variables can be seen from within Unity itself and that means that we can set them however we like.

Right-click in the hierarchy over on the left to create a new empty object and then drag it so that it’s just underneath the player in the Scene window where you want to detect the floor. Rename the object ‘Check Ground’ and then make it a child of the player just as you did with the camera. Now it should follow the player, checking the floor underneath as it does.

Select the player again and, in the inspector, drag the new Check Ground object into the space where it says ‘groundCheck’. The ‘transform’ (position) is now going to be equal to the position of the new object. While you’re here, enter 0.1 where it says radius.

Finally, we need to define our ‘ground’ layer. To do this, select the terrain you created earlier, then up in the top right in the inspector, find where it says ‘Layer: Default’. Click this drop down box and choose ‘Add Layer’.

Now click back and this time select ‘ground’ as the layer for your platform (repeat this for any other platforms you have floating around). Finally, where it says ‘What is Ground’ on your player, select the ground layer as well.

You’re now telling your player script to check if the small point on the screen is overlapping anything matching that layer. Thanks to that line we added earlier, the character will now only jump when that is the case.

And with that, if you hit play, you can enjoy a pretty basic game requiring you to click to jump at the right time.

With that, if you hit play you can enjoy a pretty basic game requiring you to click to jump at the right time. If you set your Unity up properly with the Android SDK, then you should be able to build and run this and then play on your smartphone by tapping the screen to jump.


The road ahead

Obviously there’s a lot more to add to make this a full game. The player should to be able to die and respawn. We’d want to add extra levels and more.

My aim here was to show you how quickly you can get something basic up and running. Following these instructions, you should have been able to build your infinite runner in no time simply by letting Unity handle the hard stuff, like physics.

Source: https://www.androidauthority.com/can-build...

How to Create Your Own Slide-Out Navigation Panel in Swift

This tutorial will show you how to build a slide-out navigation panel, which is a popular alternative to using a UINavigationController or a UITabBarController that allows users to slide content on or off screen.

The slide-out navigation panel design pattern lets developers add permanent navigation to their apps without taking up valuable screen real estate. The user can choose to reveal the navigation at any time, while still seeing their current context.

In this tutorial you’ll take a less-is-more approach so you can apply the slide-out navigation panel technique to your own applications with relative ease.


Getting Started

You’re going to build a slide-out navigation panel into a cute kitten and puppy photo browser. To get started, download the starter project for this tutorial. It’s a zip file, so save it to a convenient location and then extract it to get the project.

Next open the project in Xcode and take a look at how it’s organized. The Assets folder contains a couple of asset catalogs of all of the kitten and puppy images that’ll be displayed in the app. Notice too there’s three main view controllers. When the time comes to adapt this tutorial to your own projects, here’s what you should keep in mind:

  • ContainerViewController: This is where the magic happens! This contains the views of the left, center, and right view controllers and handles things like animations and swiping. In this project, it’s created and added to the window in application(_:didFinishLaunchingWithOptions:) in AppDelegate.swift
  • CenterViewController: The center panel. You can replace it with your own view controller (make sure you copy the button actions).
  • SidePanelViewController: Used for the left and right side panels. This could be replaced with your own view controller.

The views for the center, left, and right view controllers are all defined within Main.storyboard, so feel free to take a quick look to get an idea of how the app will look.

Now you’re familiar with the structure of the project, it’s time to start at square one: the center panel.

Finding Your Center

In this section, you’re going to place the CenterViewController inside the ContainerViewController, as a child view controller.

Note: This section uses a concept called View Controller Containment introduced in iOS 5. If you’re new to this concept, check out Chapter 22 in iOS 5 by Tutorials, “UIViewController Containment.”

Open ContainerViewController.swift. At the bottom of the file there’s a small extension for UIStoryboard. It adds a few static methods which make it a bit more concise to load specific view controllers from the app’s storyboard. You’ll make use of these methods soon.

Add a couple of properties to ContainerViewController for the CenterViewController and for a UINavigationController, above viewDidLoad():

var centerNavigationController: UINavigationController!
var centerViewController: CenterViewController!

Note: These are implicitly-unwrapped optionals (as denoted by the !). They have to be optional because their values won’t be initialized until after init() has been called, but they can be automatically unwrapped because once they’re created you know they will always have values.

Next, add the following block of code to viewDidLoad(), beneath the call to super:

centerViewController = UIStoryboard.centerViewController()
centerViewController.delegate = self

// wrap the centerViewController in a navigation controller, so we can push views to it
// and display bar button items in the navigation bar
centerNavigationController = UINavigationController(rootViewController: centerViewController)
view.addSubview(centerNavigationController.view)
addChildViewController(centerNavigationController)

centerNavigationController.didMove(toParentViewController: self)

The code above creates a new CenterViewController and assigns it to the centerViewController property you just created. It also creates a UINavigationController to contain the center view controller. It then adds the navigation controller’s view to ContainerViewController‘s view and sets up the parent-child relationship using addSubview(_:), addChildViewContoller(_:) and didMove(toParentViewController:).

It also sets the current view controller as the center view controller’s delegate. This will be used by the center view controller to tell its container when to show and hide the left and right side panels.

If you try to build now, you’ll see an error when the code assigns the delegate. You need to modify this class so it implements the CenterViewControllerDelegate protocol. You’ll add an extension to ContainerViewControllerto implement it. Add the following code above the UIStoryboard extension near the bottom of the file (this also includes a number of empty methods which you’ll fill out later):

// MARK: CenterViewController delegate

extension ContainerViewController: CenterViewControllerDelegate {

  func toggleLeftPanel() {
  }

  func toggleRightPanel() {
  }

  func addLeftPanelViewController() {
  }

  func addRightPanelViewController() {
  }

  func animateLeftPanel(shouldExpand: Bool) {
  }

  func animateRightPanel(shouldExpand: Bool) {
  }
}

Now is a good time to check your progress. Build and run the project. If all went well, you should see something similar to the screen below:


Yes, those buttons at the top will eventually bring you kitties and puppies. What better reason could there be for creating sliding navigation panels? But to get your cuteness fix, you’ve got to start sliding. First, to the left!

Kittens to the Left of Me…

You’ve created your center panel, but adding the left view controller requires a different set of steps. There’s quite a bit of set up to get through here, so bear with it. Think of the kittens!

To expand the left menu, the user will tap on the Kitties button in the navigation bar. So head on over to CenterViewController.swift.

In the interests of keeping this tutorial focused on the important stuff, the IBActions and IBOutlets are pre-connected for you in the storyboard. However, to implement your DIY slide-out navigation panel, you need to understand how the buttons are configured.

Notice there’s already two IBAction methods, one for each of the buttons. Find kittiesTapped(_:) and add the following implementation to it:

delegate?.toggleLeftPanel?()

As previously mentioned, the method is already hooked up to the Kitties button.

This uses optional chaining to only call toggleLeftPanel() if delegate has a value and it has implemented the method.

You can see the definition of the delegate protocol in CenterViewControllerDelegate.swift. As you’ll see, there’s optional methods toggleLeftPanel() and toggleRightPanel(). If you remember, when you set up the center view controller instance earlier, you set its delegate as the container view controller. Time to go and implement toggleLeftPanel().

Note: For more information on delegate methods and how to implement them, please refer to Apple’s Developer Documentation.

Open ContainerViewController.swift. First add an enum to the ContainerViewController class, right below the class name:

class ContainerViewController: UIViewController {

  enum SlideOutState {
    case bothCollapsed
    case leftPanelExpanded
    case rightPanelExpanded
  }

// ...

This will let you keep track of the current state of the side panels, so you can tell whether neither panel is visible, or one of the left or right panels are visible.

Next, add two more properties below your existing centerViewController property:

var currentState: SlideOutState = .bothCollapsed
var leftViewController: SidePanelViewController?

These will hold the current state, and the left side panel view controller itself:

The current state is initialized to be .bothCollapsed – that is, neither of the side panels are visible when the app first loads. The leftViewController property is an optional, because you’ll be adding and removing the view controller at various times, so it might not always have a value.

Next, add the implementation for the toggleLeftPanel() delegate method:

let notAlreadyExpanded = (currentState != .leftPanelExpanded)

if notAlreadyExpanded {
  addLeftPanelViewController()
}

animateLeftPanel(shouldExpand: notAlreadyExpanded)

First, this method checks whether the left side panel is already expanded or not. If it’s not already visible, then it adds the panel to the view hierarchy and animates it to its ‘open’ position. If the panel is already visible, then it animates the panel to its ‘closed’ position.

Next, you’ll include the code to add the left panel to the view hierarchy. Locate addLeftPanelViewController(), and add the following code inside it:

guard leftViewController == nil else { return }

if let vc = UIStoryboard.leftViewController() {
  vc.animals = Animal.allCats()
  addChildSidePanelController(vc)
  leftViewController = vc
}

The code above first checks to see if the leftViewController property is nil. If it is, then creates a new SidePanelViewController, and sets its list of animals to display – in this case, cats!

Next, add the implementation for addChildSidePanelController(_:) below addLeftPanelViewController():

func addChildSidePanelController(_ sidePanelController: SidePanelViewController) {

  view.insertSubview(sidePanelController.view, at: 0)
    
  addChildViewController(sidePanelController)
  sidePanelController.didMove(toParentViewController: self)
}

This method inserts the child view into the container view controller. This is much the same as adding the center view controller earlier. It simply inserts its view (in this case it’s inserted at z-index 0, which means it will be belowthe center view controller) and adds it as a child view controller.

It’s almost time to try the project out again, but there’s one more thing to do: add some animation! It won’t take long!

And sliiiiiiide!

First, add a constant below your other properties in ContainerViewController.swift:

let centerPanelExpandedOffset: CGFloat = 60

This value is the width, in points, of the center view controller left visible once it has animated offscreen. 60 points should do it.

Next, locate the method stub for animateLeftPanel(shouldExpand:) and add the following block of code to it:

if shouldExpand {
  currentState = .leftPanelExpanded
  animateCenterPanelXPosition(
    targetPosition: centerNavigationController.view.frame.width - centerPanelExpandedOffset)

} else {
  animateCenterPanelXPosition(targetPosition: 0) { finished in
    self.currentState = .bothCollapsed
    self.leftViewController?.view.removeFromSuperview()
    self.leftViewController = nil
  }
}

This method simply checks whether it’s been told to expand or collapse the side panel. If it should expand, then it sets the current state to indicate the left panel is expanded, and then animates the center panel so it’s open. Otherwise, it animates the center panel closed and then removes its view and sets the current state to indicate it’s closed.

Finally, add animateCenterPanelXPosition(targetPosition:completion:) underneath animatedLeftPanel(shouldExpand:):

func animateCenterPanelXPosition(targetPosition: CGFloat, completion: ((Bool) -> Void)? = nil) {

  UIView.animate(withDuration: 0.5,
                 delay: 0,
                 usingSpringWithDamping: 0.8,
                 initialSpringVelocity: 0,
                 options: .curveEaseInOut, animations: {
      self.centerNavigationController.view.frame.origin.x = targetPosition
    }, completion: completion)
  }

This is where the actual animation happens. The center view controller’s view is animated to the specified position, with a nice spring animation. The method also takes an optional completion closure, which it passes on to the UIView animation. You can try tweaking the duration and spring damping parameters if you want to change the appearance of the animation.

OK… It’s taken a little while to get everything in place, but now is a great time to build and run the project. So do it!

When you’ve run the project, try tapping on the Kitties button in the navigation bar. The center view controller should slide over – whoosh! – and reveal the Kitties menu underneath. D’aww, look how cute they all are.


But too much cuteness can be a dangerous thing! Tap the Kitties button again to hide them!

Me and my shadow

When the left panel is open, notice how it’s right up against the center view controller. It would be nice if there were a bit more of a distinction between them. How about adding a shadow?

Still in ContainerViewController.swift, add the following method below your animation methods:

func showShadowForCenterViewController(_ shouldShowShadow: Bool) {

  if shouldShowShadow {
    centerNavigationController.view.layer.shadowOpacity = 0.8
  } else {
    centerNavigationController.view.layer.shadowOpacity = 0.0
  }
}

This adjusts the opacity of the navigation controller’s shadow to make it visible or hidden. You can implement a didSet observer to add or remove the shadow whenever the currentState property changes.

Next, scroll to the top of ContainerViewController.swift and change the currentState declaration to:

var currentState: SlideOutState = .bothCollapsed {
  didSet {
      let shouldShowShadow = currentState != .bothCollapsed
      showShadowForCenterViewController(shouldShowShadow)
    }
}

The didSet closure will be called whenever the property’s value changes. If either of the panels are expanded, then it shows the shadow.

Build and run the project again. This time when you tap the kitties button, check out the sweet new shadow! Looks better, huh?


Up next, adding the same functionality but for the right side, which means… puppies!

Puppies to the Right…

To add the right panel view controller, simply repeat the steps for adding the left view controller.

Open ContainerViewController.swift, and add the following property below the leftViewController property:

var rightViewController: SidePanelViewController?

Next, locate toggleRightPanel(), and add the following implementation:

let notAlreadyExpanded = (currentState != .rightPanelExpanded)

if notAlreadyExpanded {
  addRightPanelViewController()
}

animateRightPanel(shouldExpand: notAlreadyExpanded)

Next, replace the implementations for addRightPanelViewController() and animateRightPanel(shouldExpand:) with the following:

func addRightPanelViewController() {

  guard rightViewController == nil else { return }

  if let vc = UIStoryboard.rightViewController() {
    vc.animals = Animal.allDogs()
    addChildSidePanelController(vc)
    rightViewController = vc
  }
}

func animateRightPanel(shouldExpand: Bool) {

  if shouldExpand {
    currentState = .rightPanelExpanded
    animateCenterPanelXPosition(
      targetPosition: -centerNavigationController.view.frame.width + centerPanelExpandedOffset)

  } else {
    animateCenterPanelXPosition(targetPosition: 0) { _ in
      self.currentState = .bothCollapsed
        
      self.rightViewController?.view.removeFromSuperview()
      self.rightViewController = nil
    }
  }
}

The code above is almost an exact duplicate of the code for the left panel, except of course for the differences in method and property names and the direction. If you have any questions about it, review the explanation from the previous section.

Just as before, the IBActions and IBOutlets have been connected in the storyboard for you. Similar to the Kitties button, the Puppies button is hooked up to an IBAction method named puppiesTapped(_:). This button controls the sliding of the center panel to reveal the right-side panel.

Finally, switch to CenterViewController.swift and add the following snippet to puppiesTapped(_:):

delegate?.toggleRightPanel?()

Again, this is the same as kittiesTapped(_:), except it’s toggling the right panel instead of the left.

Time to see some puppies!

Build and run the program again to make sure everything is working. Tap on the Puppies button. Your screen should look like this:


Looking good, right? But remember, you don’t want to expose yourself to the cuteness of puppies for too long, so tap that button again to hide them away.

You can now view both kitties and puppies, but it would be great to be able to view a bigger picture of each one, wouldn’t it? MORE CUTENESS :]

Pick An Animal, Any Animal

The kitties and puppies are listed within the left and right panels. These are both instances of SidePanelViewController, which essentially just contain table views.

Head over to SidePanelViewControllerDelegate.swift to take a look at the SidePanelViewControllerdelegate method. A side panel’s delegate can be notified via this method whenever an animal is tapped. Let’s use it!

In SidePanelViewController.swift, first add an optional delegate property at the top of the class, underneath the table view IBOutlet:

var delegate: SidePanelViewControllerDelegate?

Then fill in the implementation for tableView(_:didSelectRowAt:) within the UITableViewDelegate extension:

func tableView(_ tableView: UITableView, didSelectRowAt indexPath: IndexPath) {
  let animal = animals[indexPath.row]
  delegate?.didSelectAnimal(animal)
}

If there’s a delegate set, this will tell it an animal has been selected. Currently there’s no delegate yet! It would make sense for CenterViewController to be the side panel’s delegate, as it can then display the selected animal photo and title.

Open up CenterViewController.swift to implement the delegate protocol. Add the following extension to the bottom of the file, beneath the existing class definition:

extension CenterViewController: SidePanelViewControllerDelegate {

  func didSelectAnimal(_ animal: Animal) {
    imageView.image = animal.image
    titleLabel.text = animal.title
    creatorLabel.text = animal.creator
    
    delegate?.collapseSidePanels?()
  }
}

This method simply populates the image view and labels in the center view controller with the animal’s image, title, and creator. Then, if the center view controller has a delegate of its own, you can tell it to collapse the side panel away so you can focus on the selected item.

collapseSidePanels() is not implemented yet. Open, ContainerViewController.swift and add the following method below toggleRightPanel():

func collapseSidePanels() {

  switch currentState {
    case .rightPanelExpanded:
      toggleRightPanel()
    case .leftPanelExpanded:
      toggleLeftPanel()
    default:
    	break
  }
}

The switch statement in this method simply checks the current state of the side panels, and collapses whichever one is open (if any!).

Finally, update addChildSidePanelViewController(_:) to the following implementation:

func addChildSidePanelController(_ sidePanelController: SidePanelViewController) {
  sidePanelController.delegate = centerViewController
  view.insertSubview(sidePanelController.view, at: 0)
    
  addChildViewController(sidePanelController)
  sidePanelController.didMove(toParentViewController: self)
}

In addition to what it was doing previously, the method will now set the center view controller as the side panels’ delegate.

That should do it! Build and run the project again. View kitties or puppies, and tap on one of the cute little critters. The side panel should collapse itself again and you should see the details of the animal you chose.


Move Your Hands Back and Forth

The navigation bar buttons are great, but most apps also allow you to “swipe” to open the side panels. Adding gestures to your app is surprisingly simple. Don’t be intimated; you’ll do fine!

Open ContainerViewController.swift and locate viewDidLoad(). Add the following to the end of the method:

let panGestureRecognizer = UIPanGestureRecognizer(target: self, action: #selector(handlePanGesture(_:)))
centerNavigationController.view.addGestureRecognizer(panGestureRecognizer)

The above code defines a UIPanGestureRecognizer and assigns handlePanGesture(_:) to it to handle any detected pan gestures. (You will write the code for that method in a moment.)

By default, a pan gesture recognizer detects a single touch with a single finger, so it doesn’t need any extra configuration. You just need to add the newly created gesture recognizer to centerNavigationController view.

Note: Refer to our Using UIGestureRecognizer with Swift Tutorial for more information about gesture recognizers in iOS.

Next make this class a UIGestureRecognizerDelegate by adding the following extension at the bottom of the file, above the UIStoryboard extension:

// MARK: Gesture recognizer

extension ContainerViewController: UIGestureRecognizerDelegate {

  @objc func handlePanGesture(_ recognizer: UIPanGestureRecognizer) {
  }
}

Didn’t I tell you it’d be simple? There’s only one move remaining in your slide-out navigation panel routine.

Now Move That View!

The gesture recognizer calls handlePanGesture(_:) when it detects a gesture. So your last task for this tutorial is to implement the method.

Add the following block of code to the method stub you just added above (it’s a big one!):

let gestureIsDraggingFromLeftToRight = (recognizer.velocity(in: view).x > 0)
    
  switch recognizer.state {

    case .began:
      if currentState == .bothCollapsed {
        if gestureIsDraggingFromLeftToRight {
          addLeftPanelViewController()
        } else {
          addRightPanelViewController()
        }
        
        showShadowForCenterViewController(true)
      }
      
  case .changed:
    if let rview = recognizer.view {
      rview.center.x = rview.center.x + recognizer.translation(in: view).x
      recognizer.setTranslation(CGPoint.zero, in: view)
    }
      
  case .ended:
    if let _ = leftViewController,
      let rview = recognizer.view {
      // animate the side panel open or closed based on whether the view
      // has moved more or less than halfway
      let hasMovedGreaterThanHalfway = rview.center.x > view.bounds.size.width
      animateLeftPanel(shouldExpand: hasMovedGreaterThanHalfway)
        
    } else if let _ = rightViewController,
      let rview = recognizer.view {
      let hasMovedGreaterThanHalfway = rview.center.x < 0
      animateRightPanel(shouldExpand: hasMovedGreaterThanHalfway)
    }
      
  default:
    break
}

The pan gesture recognizer detects pans in any direction, but you're only interested in horizontal movement. First, you set up the gestureIsDraggingFromLeftToRight Boolean to check for this using the x component of the gesture velocity.

There's three states that need to be tracked: UIGestureRecognizerState.began, UIGestureRecognizerState.changed, and UIGestureRecognizerState.ended:

  • .began: If the user starts panning, and neither panel is visible then shows the correct panel based on the pan direction and makes the shadow visible.
  • .changed: If the user is already panning, moves the center view controller's view by the amount the user has panned
  • .ended: When the pan ends, check whether the left or right view controller is visible. Depending on which one is visible and how far the pan has gone, perform the animation.

You can move the center view around, and show and hide the left and right views using a combination of these three states, as well as the location and velocity / direction of the pan gesture.

For example, if the gesture direction is right, then show the left panel. If the direction is left, then show the right panel.

Build and run the program again. At this point, you should be able to slide the center panel left and right, revealing the panels underneath. If everything is working... you're good to go!

Where to Go from Here?

Congratulations! If you made it all the way through, you're a slide-out navigation panel ninja!

I hope you enjoyed this tutorial. Feel free to download the completed project file. I'm sure you'll enjoy being stuck in the middle of kitties and puppies!

If you want to try a pre-built library over the DIY solution, be sure to check out SideMenu. For an in-depth discussion of the origins of this UI control (and a trip down memory lane), check out iOS developer and designer Ken Yarmosh's post New iOS Design Pattern: Slide-Out Navigation. He does a great job of explaining the benefits of using this design pattern and showing common uses in the wild.

Source: https://www.raywenderlich.com/177353/creat...